
What Continuous Physiologic Data Reveals About Cardiogenic Shock
Blog

A retrospective analysis compared cardiogenic shock staging built from charted values with staging built from continuous data. The differences were clinically meaningful.
In one patient’s record from the analysis, the chart shows a mean arterial pressure of 71 mmHg, and an hour later, 66 mmHg. Read on their own, the two values suggest a patient holding steady. The arterial line tells a different story. Between those entries, pressure fell to around 60 mmHg and stayed there for roughly half an hour before recovering. None of it reached the chart.
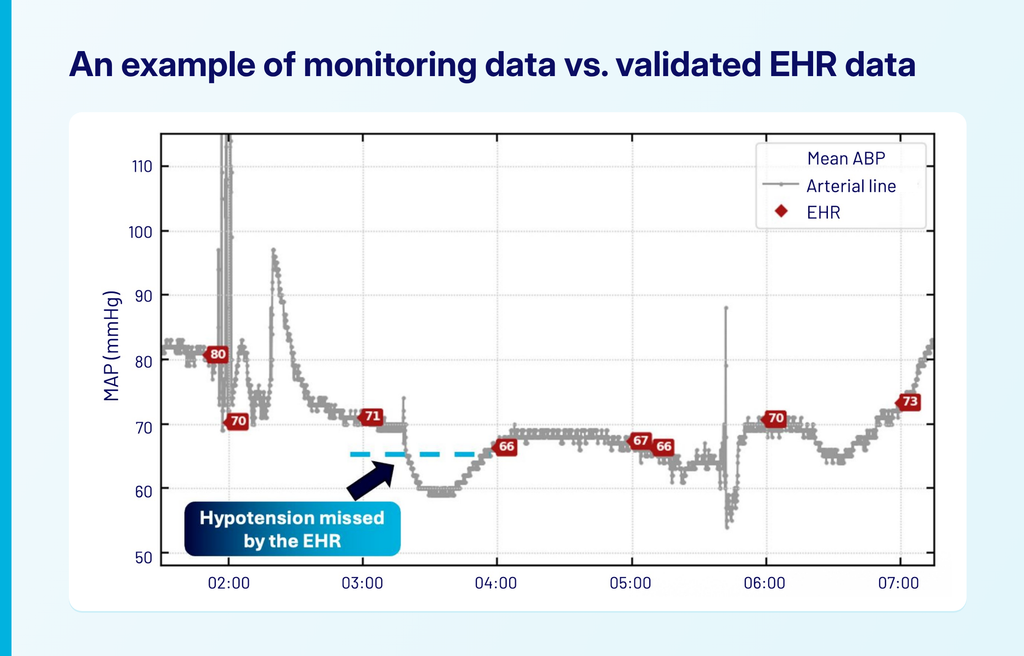
That gap between charted and continuous data was the subject of a retrospective analysis at a single tertiary academic medical center. Over 12 months, researchers studied 571 medical cardiac ICU hospitalizations and 406 patients admitted to a cardiothoracic ICU after CABG.
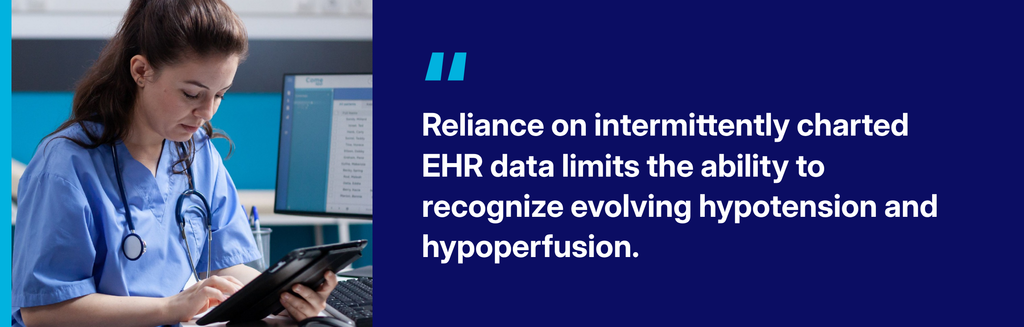
Staging that reflects the patient’s physiology
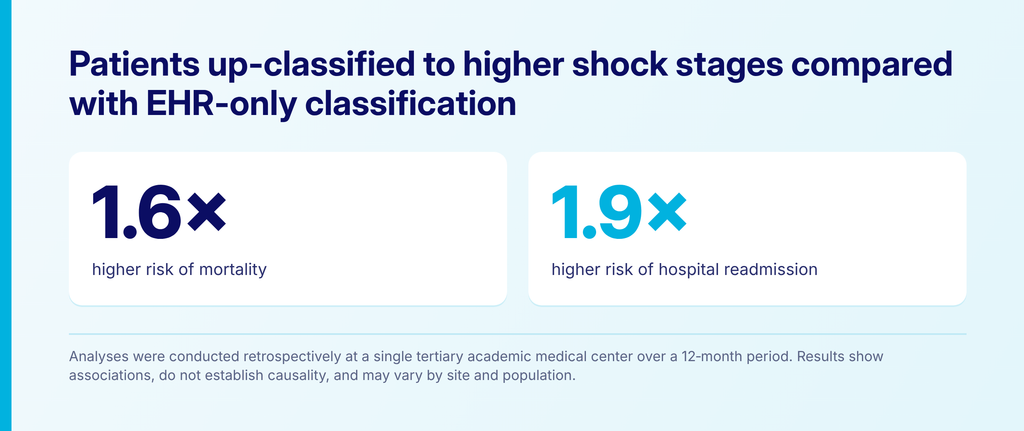
The team applied SCAI staging to two versions of the same data: charted EHR values alone, and the same values combined with second-by-second arterial and cuff pressures. With the continuous data, a subset of patients met criteria for a higher stage of shock than the chart reflected. Those patients carried 1.6 times the risk of mortality and 1.9 times the risk of hospital readmission. Even among patients who reached the same maximum stage under both methods, the EHR-only view reached it substantially later.
The weight of each hour
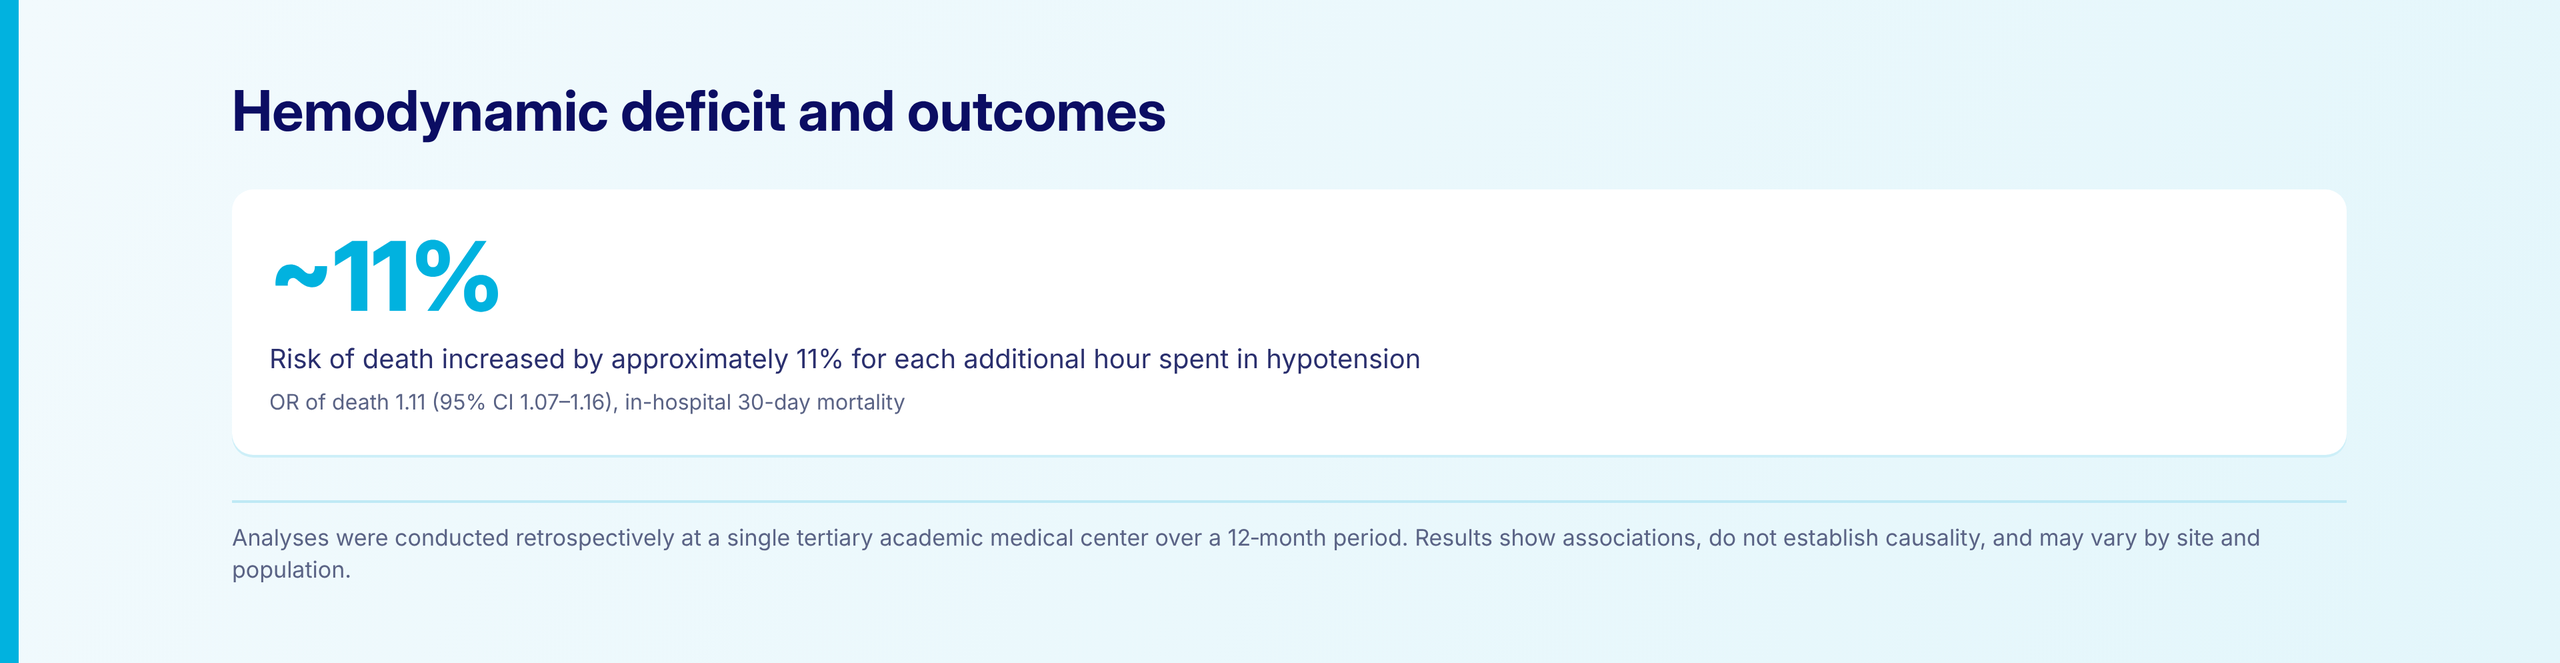
Continuous data also made it possible to measure how long each patient spent in hypotension and hypoperfusion. After accounting for age and sex, each additional hour of hypotension was associated with approximately 11% higher odds of in-hospital 30-day mortality (odds ratio 1.11; 95% CI 1.07–1.16), and each additional hour of hypoperfusion with approximately 5% higher odds (odds ratio 1.05; 95% CI 1.03–1.08). The finding points to the clinical relevance of cumulative hemodynamic burden rather than any single measurement.
What the record left out
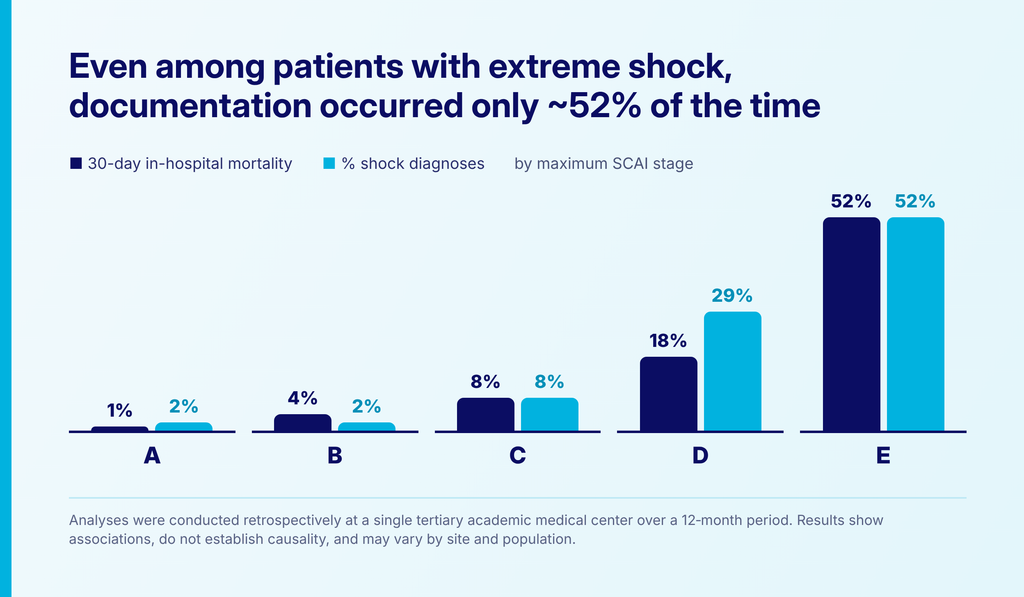
Documentation rose with severity but remained incomplete. Among patients at SCAI Stage E, where in-hospital 30-day mortality was 52%, a shock diagnosis was recorded in only about 52% of hospitalizations.
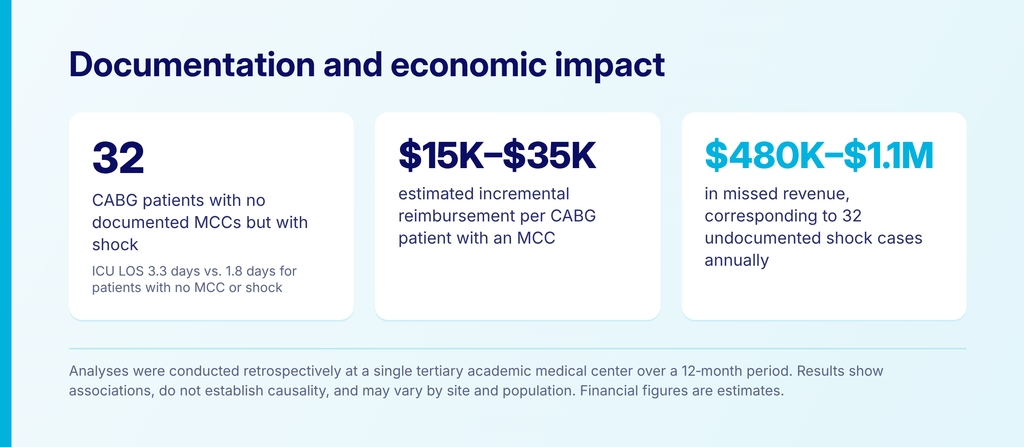
The pattern held after surgery. Thirty-two CABG patients met the study’s shock criteria, with sustained hypotension, signs of hypoperfusion and significant vasoactive support, yet had no major complication or comorbidity documented. Their median ICU stay was 3.3 days, compared with 1.8 days for patients with neither shock nor a documented MCC. Using an estimated $15,000 to $35,000 in incremental reimbursement per CABG case with an MCC, those cases represent an estimated $480,000 to $1.1 million in missed revenue each year at this site.
What it suggests
Taken together, the findings suggest that applying a hospital’s own shock criteria to continuous physiologic data can give clinicians a more complete view of shock severity, complementing their charting, and can support documentation that better reflects patient acuity. The Etiometry Platform brings together data from bedside devices, labs, medications and the EHR to make that view available for clinician review.
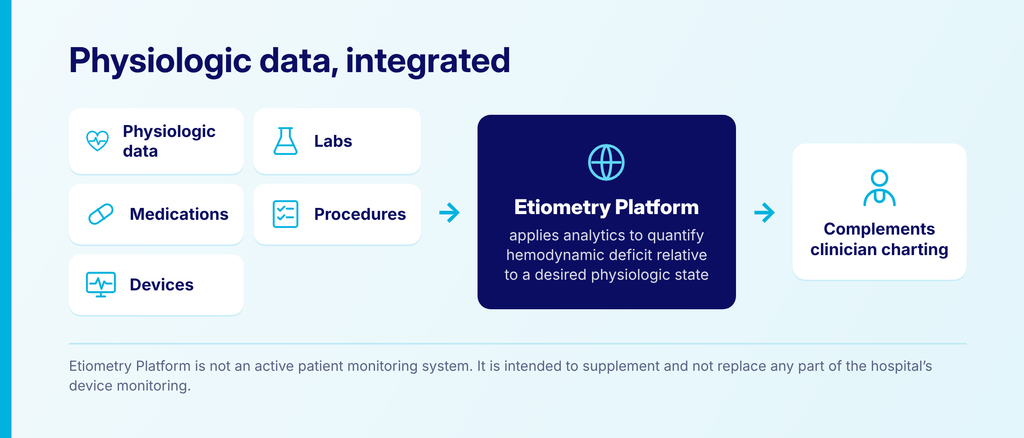
These findings come from a retrospective, observational, single-site analysis; they show associations and do not establish causality, and results may vary by site and population. Financial figures are estimates. The Etiometry Platform is not an active patient-monitoring or alarm system and does not diagnose or predict clinical events. It is a clinician-configured decision-support tool and does not independently identify or treat cardiogenic shock.
Source: Etiometry White Paper: Retrospective Assessment of the Etiometry Platform for Cardiogenic Shock (ETI-WP-CS-Assessment-003).
Related
How Documentation, Length of Stay and Capacity Shape Cardiac Surgery Margins
What four years of CABG data from one cardiothoracic ICU suggest about each. Most patients recover from coronary artery bypass grafting along a familiar path: extubation, vasoactive weaning, transfer to the floor, discharge. For some, the postoperative course brings respiratory failure, acute kidney injury or cardiogenic shock. Those complications shape the patient’s recovery, and they […]
When Cardiogenic Shock Goes Undocumented: The Clinical and Financial Cost
A missed or unrecorded diagnosis affects the patient first, and the hospital’s ability to care for the next patient soon after. In a busy cardiac ICU, cardiogenic shock is often managed before it is named. Pressors are titrated, labs are trended and the team responds to what the patient’s physiology is telling them. But the […]
SCAI Staging and the Growing Role of AI in Cardiogenic Shock Care
A shared framework has given shock care a common language. Applying it consistently is where clinicians are beginning to look for support. Cardiogenic shock is defined by critically reduced cardiac output and the end-organ hypoperfusion that follows. Despite decades of progress in interventional cardiology, short-term mortality still ranges from 30% to 40%, and one-year mortality […]