
How Documentation, Length of Stay and Capacity Shape Cardiac Surgery Margins
Blog

What four years of CABG data from one cardiothoracic ICU suggest about each.
Most patients recover from coronary artery bypass grafting along a familiar path: extubation, vasoactive weaning, transfer to the floor, discharge. For some, the postoperative course brings respiratory failure, acute kidney injury or cardiogenic shock. Those complications shape the patient’s recovery, and they shape the program’s finances in ways that are easy to overlook.
A retrospective analysis of 954 CABG hospitalizations over four years at a tertiary medical center’s cardiothoracic ICU, conducted alongside use of the Etiometry Platform, examined that relationship. Its framework is simple:
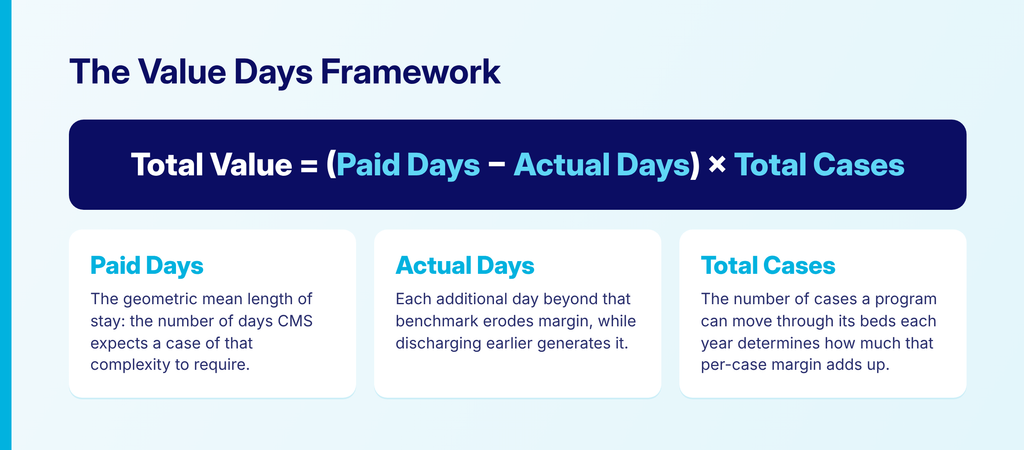
Total Value = (Paid Days − Actual Days) × Total Cases
Under Medicare’s prospective payment system, each DRG carries a geometric mean length of stay, the days CMS expects a case of that complexity to require. Discharging sooner than that benchmark generates margin; staying longer erodes it. The number of cases a program can move through its beds determines how far that margin extends.
Paid Days: the complication that goes undocumented
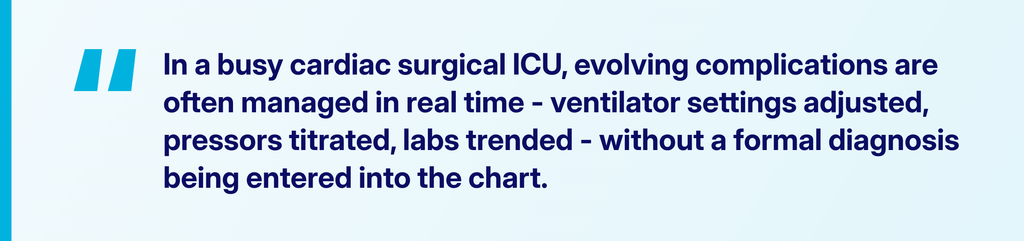
In a busy CTICU, complications are often managed at the bedside without a formal diagnosis entered in the chart. For CABG, the difference between the “with MCC” and “without MCC” DRGs is nearly three expected days and about two points of relative weight, roughly $20,000 per case at an illustrative $10,000 base rate.

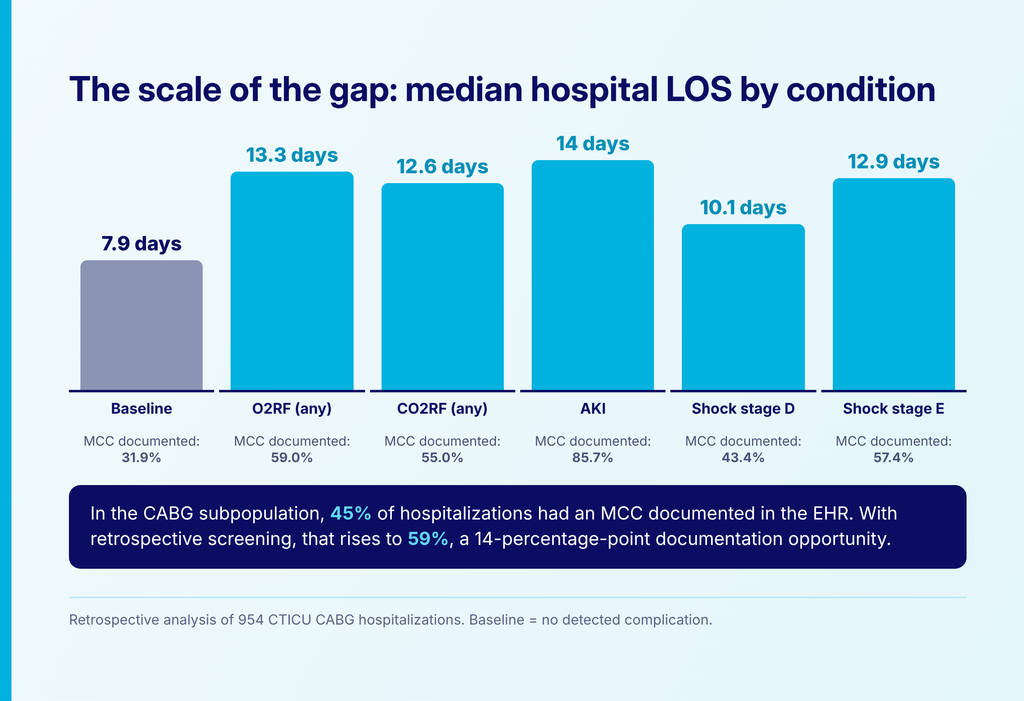
Applying screening criteria to continuous physiologic data, the analysis found substantial gaps. Among patients who met criteria for Stage D cardiogenic shock, only 43% had an MCC documented in the EHR. Patients meeting criteria for any of the screened complications stayed a median of 10 to 14 days, compared with 7.9 days for patients with no identified complication. Overall, the documented MCC rate would rise from 45% to 59% with screening. Functionality that provides clinicians and documentation teams with this time-stamped physiologic evidence received FDA clearance in April 2026.
Actual Days: a natural experiment
Platform use varied with rotating provider schedules rather than with patient complexity, creating a natural experiment. Of the 954 patients, 447 had platform use during the first postoperative day and 507 did not, and the two groups were well balanced at baseline. Platform use was associated with ICU stays 14% shorter (3.0 versus 3.5 days), hospital stays 18% shorter (7.3 versus 8.9 days) and a 24% lower relative rate of major complications (39% versus 51%). Thirty-day mortality was 1.1% versus 2.0%, a difference that was not statistically significant.
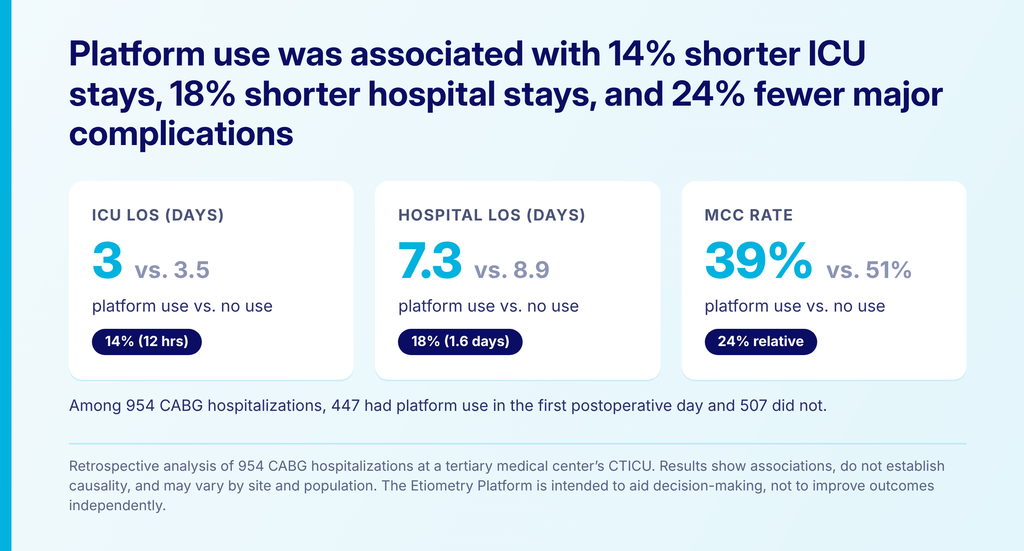
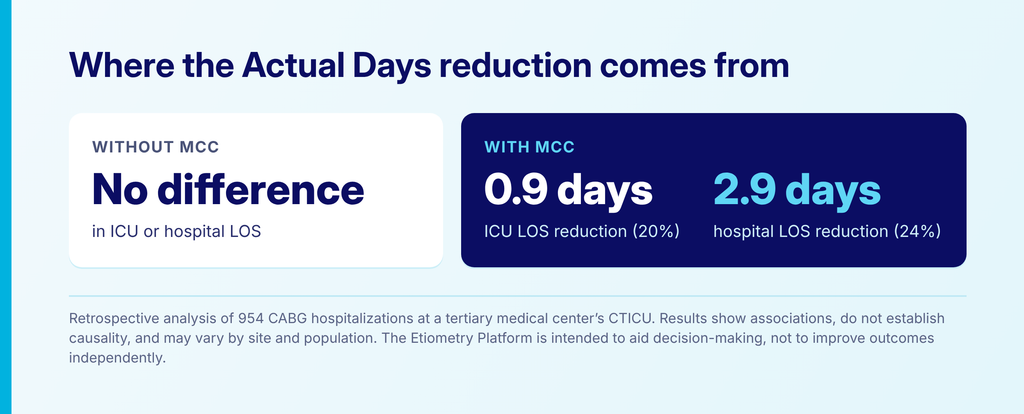
The differences were concentrated among patients who developed complications. Uncomplicated recoveries looked the same either way, while patients with an MCC had ICU stays 0.9 days shorter and hospital stays 2.9 days shorter.
Total Cases: when freed days become capacity
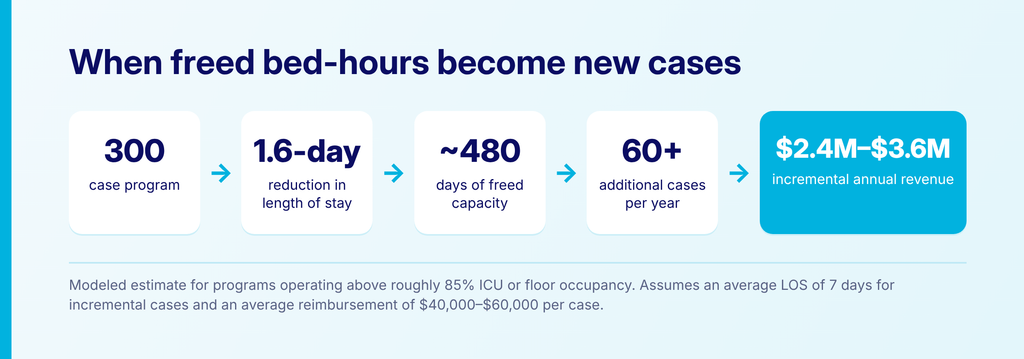
In units running above roughly 85% occupancy, a shorter stay means a bed available for the next surgical patient. Modeled for a 300-case program, a 1.6-day reduction in stay would free about 480 bed-days, enough for more than 60 additional cases and an estimated $2.4 million to $3.6 million in annual revenue.
The most meaningful gains appear when all three improve together. For program-specific modeling, contact info@etiometry.com.
Outcome findings come from a retrospective, observational, single-site analysis; they show associations and do not establish causality, and results may vary by site and population. Documentation and capacity figures are modeled estimates. The Etiometry Platform is intended to aid clinician review and is not intended to improve outcomes independently. It is not an active patient-monitoring or alarm system and does not diagnose or predict clinical events.
Source: Etiometry White Paper: Maximizing Value Days in Cardiac Surgical Care: Real-World Evidence From Four Years of Clinical Intelligence Technology Use at a Tertiary Medical Center’s CTICU (ETI-WP-Cardiac-Value-001).
Related

What Continuous Physiologic Data Reveals About Cardiogenic Shock
A retrospective analysis compared cardiogenic shock staging built from charted values with staging built from continuous data. The differences were clinically meaningful. In one patient’s record from the analysis, the chart shows a mean arterial pressure of 71 mmHg, and an hour later, 66 mmHg. Read on their own, the two values suggest a patient […]
When Cardiogenic Shock Goes Undocumented: The Clinical and Financial Cost
A missed or unrecorded diagnosis affects the patient first, and the hospital’s ability to care for the next patient soon after. In a busy cardiac ICU, cardiogenic shock is often managed before it is named. Pressors are titrated, labs are trended and the team responds to what the patient’s physiology is telling them. But the […]

SCAI Staging and the Growing Role of AI in Cardiogenic Shock Care
A shared framework has given shock care a common language. Applying it consistently is where clinicians are beginning to look for support. Cardiogenic shock is defined by critically reduced cardiac output and the end-organ hypoperfusion that follows. Despite decades of progress in interventional cardiology, short-term mortality still ranges from 30% to 40%, and one-year mortality […]