Data Aggregation and Visualization
View patient conditions at the bedside, remotely and/or a central monitoring station
Request Demo Contact Us
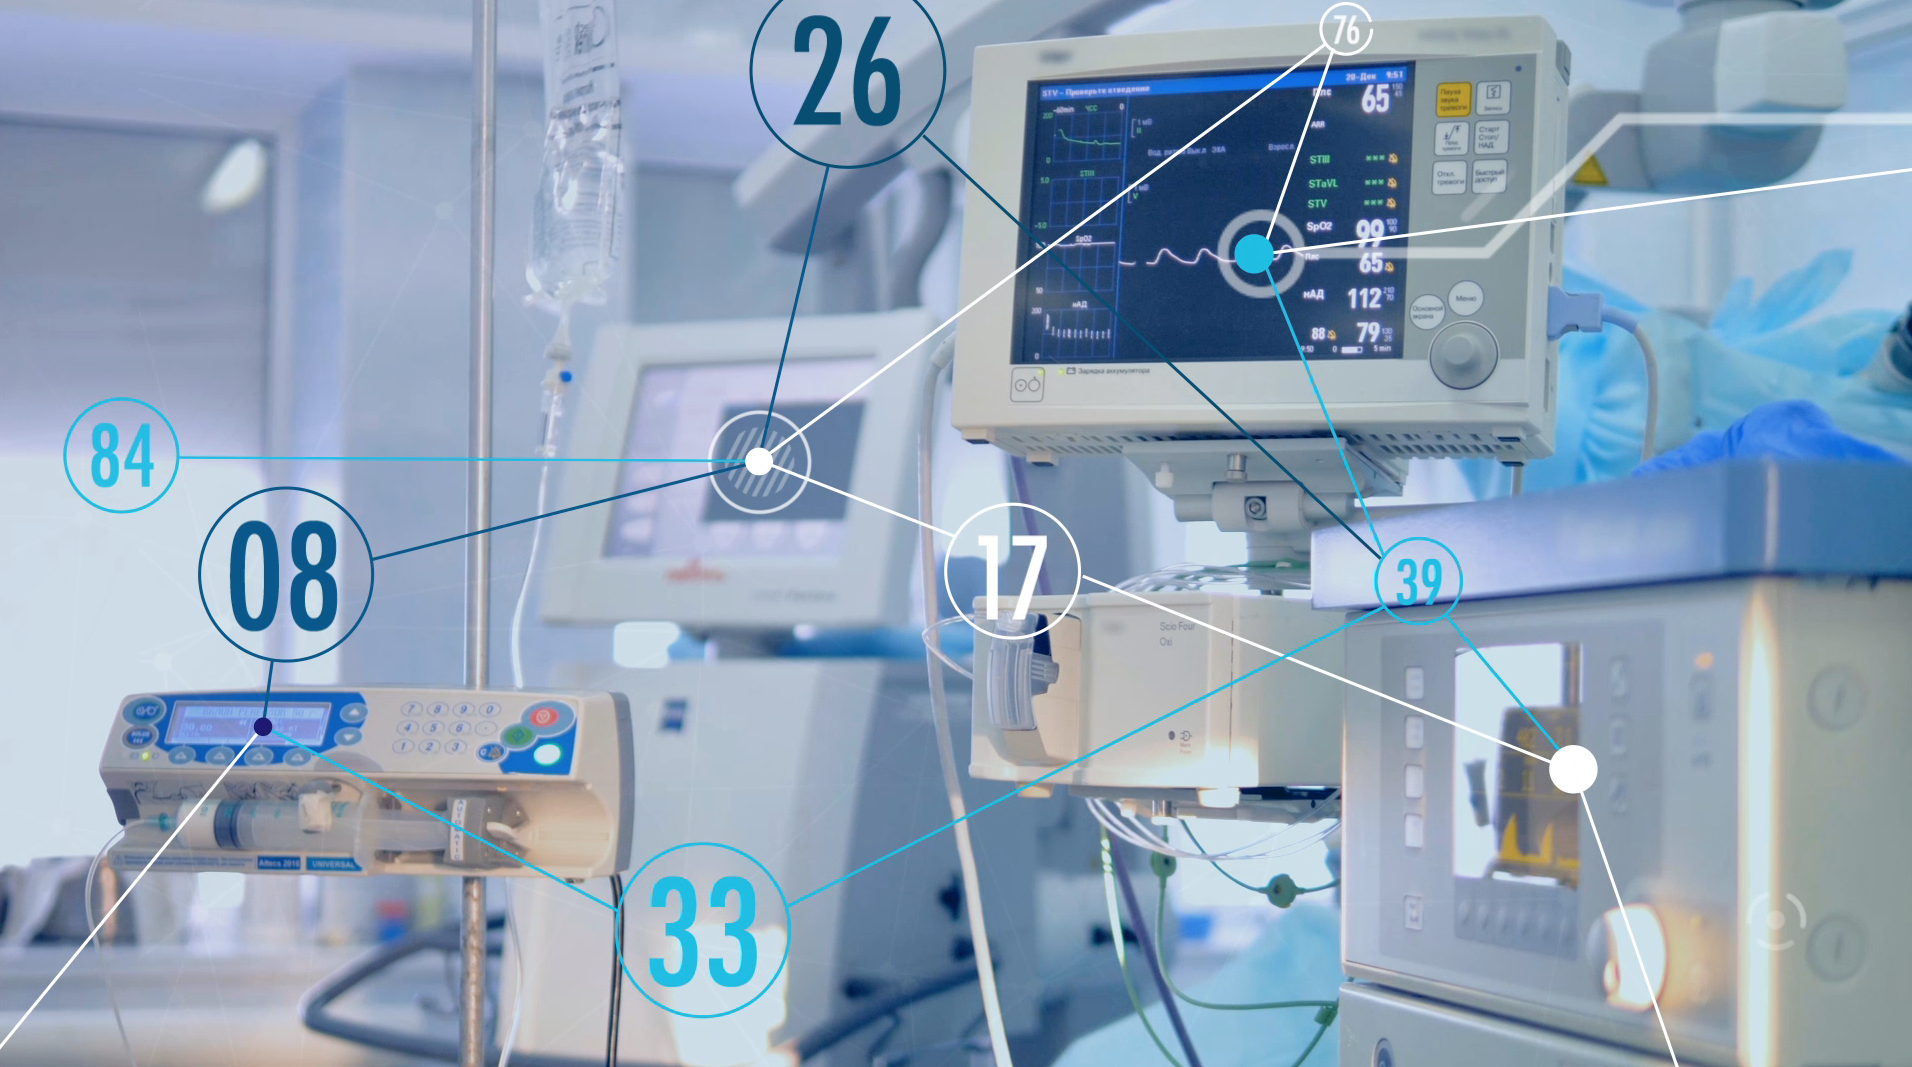
Device interface and data aggregation
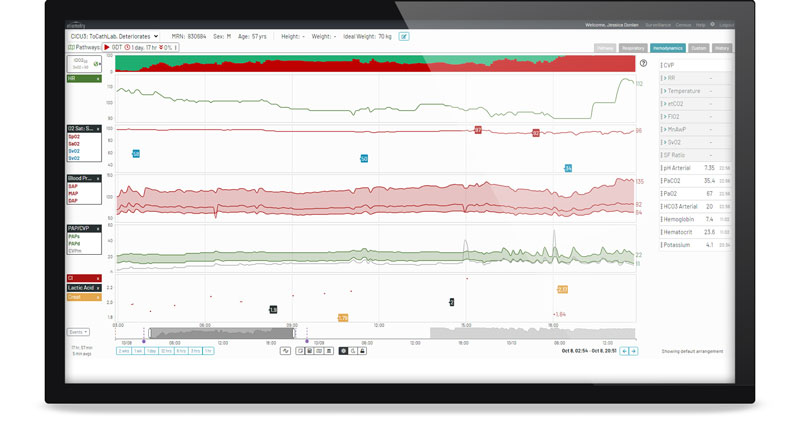
Break down silos of information with a shared mental model to provide patients the right care at the right time.
Data aggregation and visualization allows the Etiometry platform to bring together lab results, vital signs, demographics, medications, fluid balance, peripheral devices and waveforms on one screen.

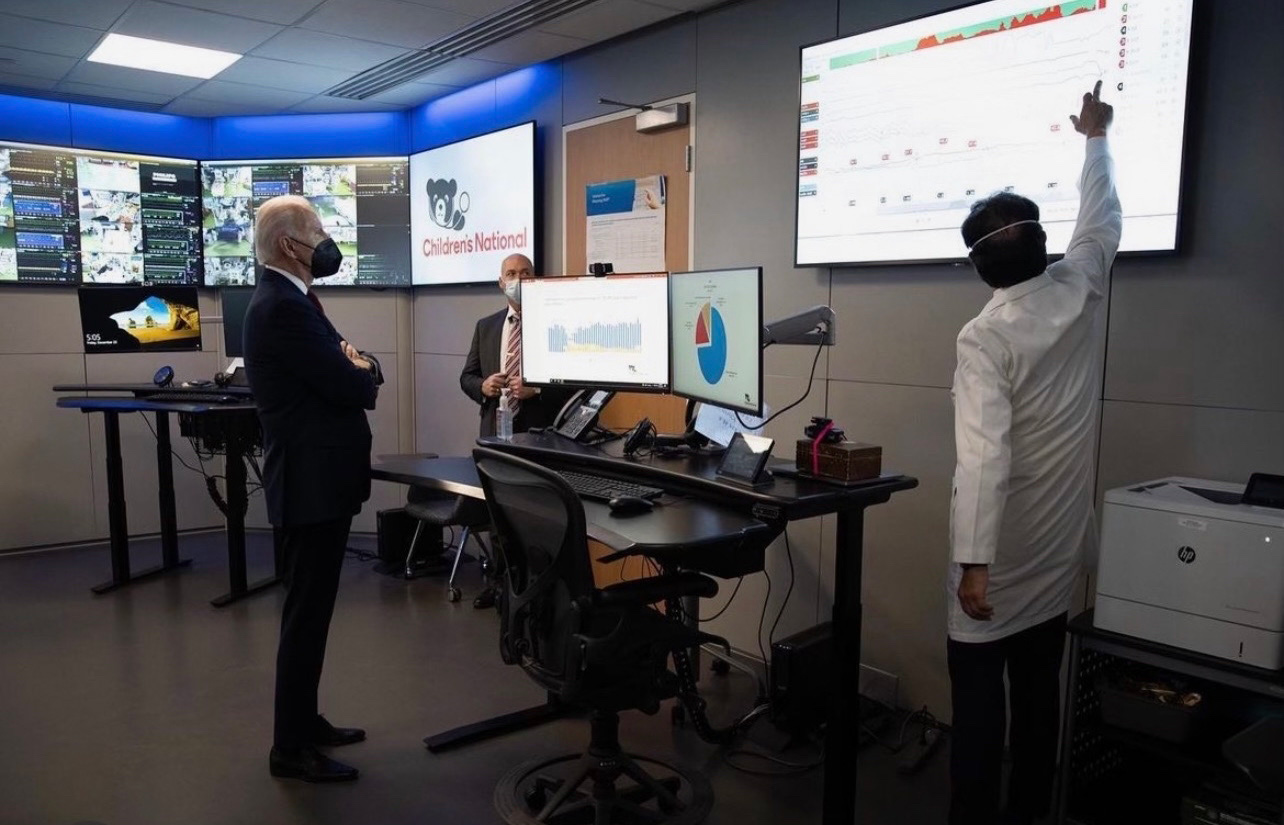
Understand and communicate the patient condition from any location
Easily and conveniently access Etiometry’s web-based platform from:
- Central monitoring stations
- Bedside: Persistent display
- Telehealth command center
- Workstation on Wheels (WOW)
- Home/Remotely via VPN


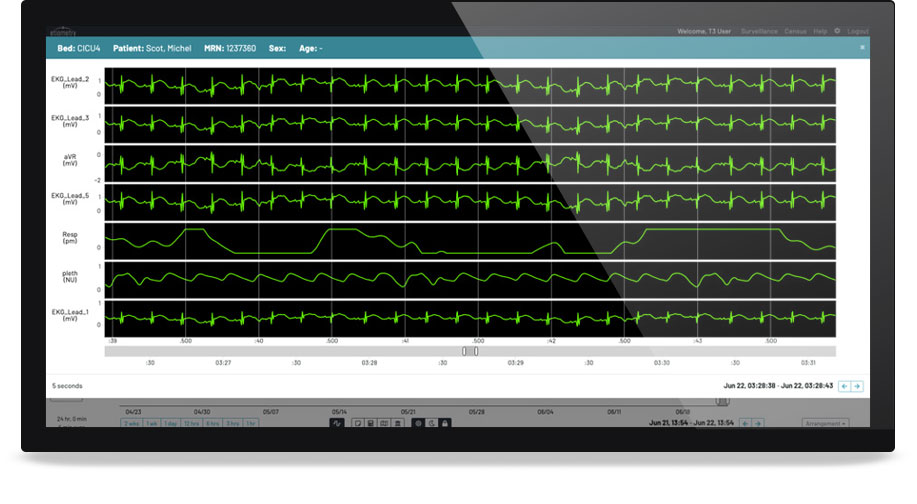
Waveforms
Visualize near-real-time and retrospective data for assessments. Note Etiometry’s efficient storage of waveforms data at only 13 GB per bed a year.